Printable USDA Hardiness Zone Chart
Last updated 2026-06-03

Download
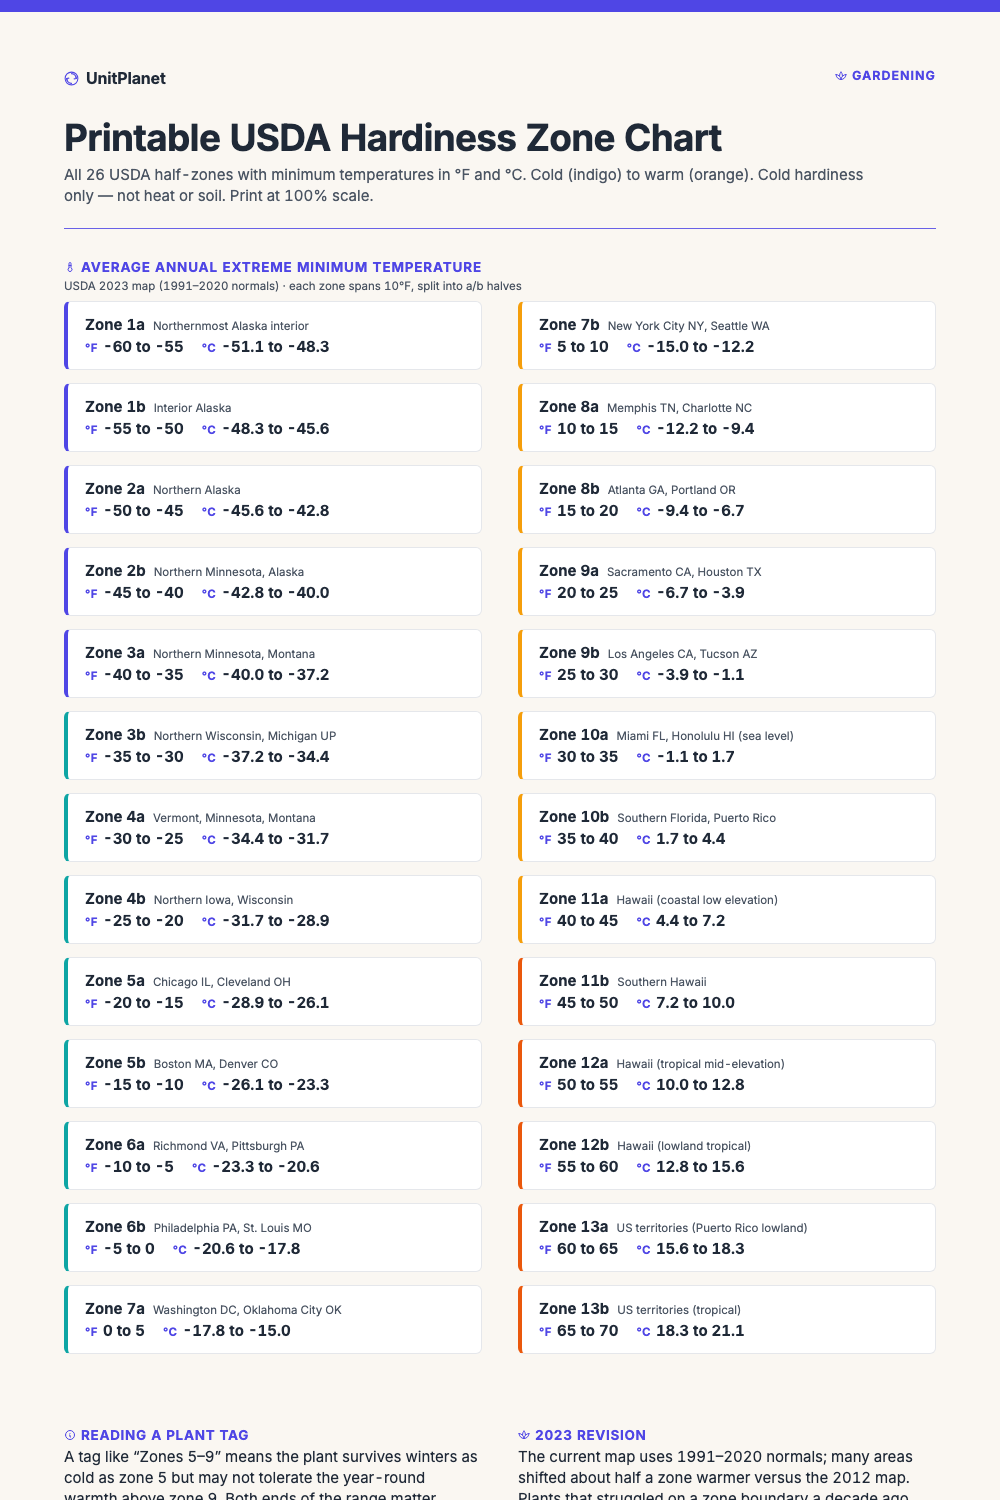
A one-page reference to all 26 USDA plant hardiness half-zones (1a through 13b), each with its average annual extreme minimum temperature in °F and °C and a typical US region. Zones are based on the USDA 2023 map (1991–2020 normals) and describe winter cold hardiness only — not summer heat, humidity, or soil. The color-graded left border runs cold (indigo) to warm (orange) so you can place a region at a glance. Print at 100% scale for the potting bench, or pin it for planting season. Download as a US Letter PDF, an A4 PDF, or a Pinterest-ready PNG.
For best results, print at 100% scale— not “fit to page.”